This is an interesting question asked often while one touches and senses the plasma by optical emission spectrometry.
The radiation we are measuring with the EmiCon OES system is due to a two-step process in the plasma:
1. Ground state atoms are excited by electron collisions in higher electronic levels. The density of the excited atoms in a specific electronic level depends on the energy gap between the ground state (0 eV) and the higher electronic level and the electron temperature (i.e. electron energy distribution function EEDF, often Maxwelliam). The larger the gap the less is the density of the atom in this specific energy level.
2. From the higher electronic level the atom is decaying by spontaneous emission to some lower electronic level. This is the radiation we are measuring. The intensity given in the SpecLine database is the probability that the atom in the specific higher electron level will decay into the given lower electronic level.


This means for the Hg spectrum:
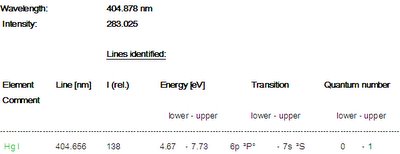
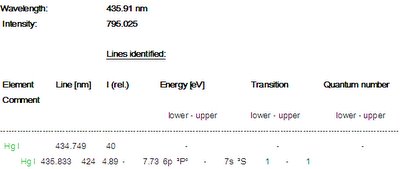
A.The lines at 404 nm, 435 nm and 546 nm are all decaying from the electronic level 7s2S with energy 7.73 eV. These there lines show an intensity distribution as given by the intensity values of the SpecLine database.
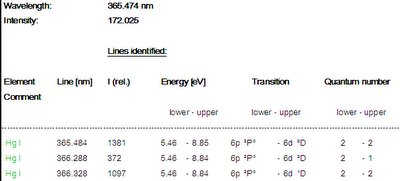
B. The line at 365 nm is decaying form the electronic level 6p2P° with energy 8.85 eV and the line 579 nm is decaying from the electronic level 6p1P° with energy 8.84 eV. Allthough these lines have a higher probability to decay than the lines form the 7s2S level, the denstiy of atoms in the 6p levels is much smaller due to the higher energy of the excited level (8.85 eV and 7.73 eV for the 7s level).


In general, the intensity of a line is ruled first by the excitation process (i.e. the energy of the higher electronic level) and second by the probabilty of decaying from the higher level to a lower level.
The remaining differences in the intensities of the lines is due to the sensitivity distribution of the EmiCon system, i.e. the system is most sensitive between 450 and 550 nm and less sensitive below 400 nm.
~~~ supported by Dr. Thomas Schütte of PLASUS ~~~


